First Quarter 2013 Market Results
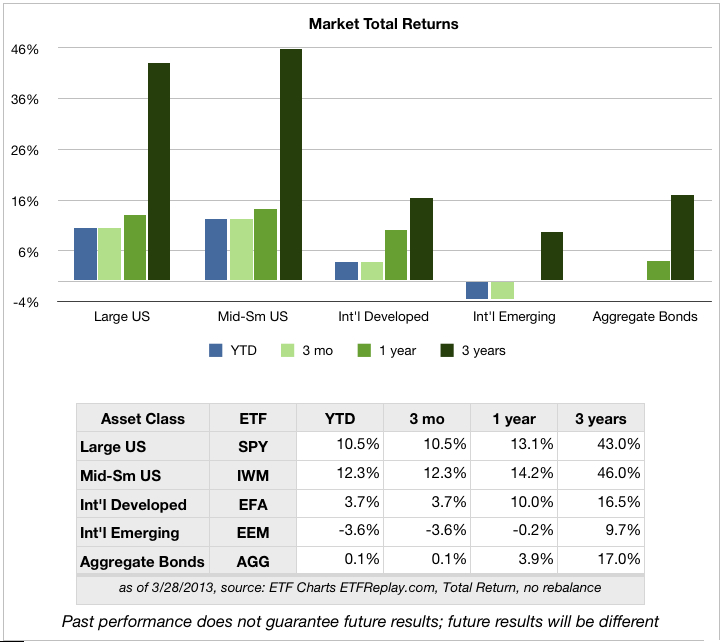
It’s official: the S&P 500 index (largest 500 companies in the US) closed at a record high of 1569 Thursday March 28, eclipsing the previous record close in October 2007–nearly 5 1/2 years ago. Between then and now, the index fell to 666 and from that low climbed 135% to Thursday’s close. In the first three months of 2013, the S&P 500 returned a total of 10.5%
Does the record high mean it’s time for another record fall? No one knows where markets will be with certainty, but it is clear that US corporate profitability is much better now than in 2007. Generally, higher profits justify higher stock prices. In 2007, one measure of the valuation of stocks — the Price-to-Earnings (P/E) ratio — was at 15.7; now it’s 14.2, according to the Financial Times. That means stocks are now priced lower, taking profitability into account.
Still, it’s been a steep run-up in the first quarter and very unlikely to continue at this pace for the rest of the year.
More broadly, US mid- and small-company stocks did even better in the first quarter, gaining 12.3%. International developed country stocks did well (though it seems modest by comparison) earning a total of 3.7% in the quarter. Emerging markets stocks declined 3.7%. A broad index of bonds was flat.
According to the Wall St. Journal, individual investors now have confidence in the stock market and started to put money into stock mutual funds after pulling money out since 2007. Unfortunately, individual investors don’t have a good track record of deciding when to enter the market, so this might not be a positive indicator.
No one can predict the future of the capital markets, but it does appear that US economic fundamentals are broadly heading in the right direction (see Signs of Spring). Of course, we can get nasty surprises along the way (Cyprus banks, Italian election, floods, drought, etc.). And an important wildcard is the Federal Reserve’s “loose money” policy that will come to an end some day and start to drive up interest rates.

