Long Term Trends: Employment
What does a 25-year chart of unemployment tell us about the US economy?
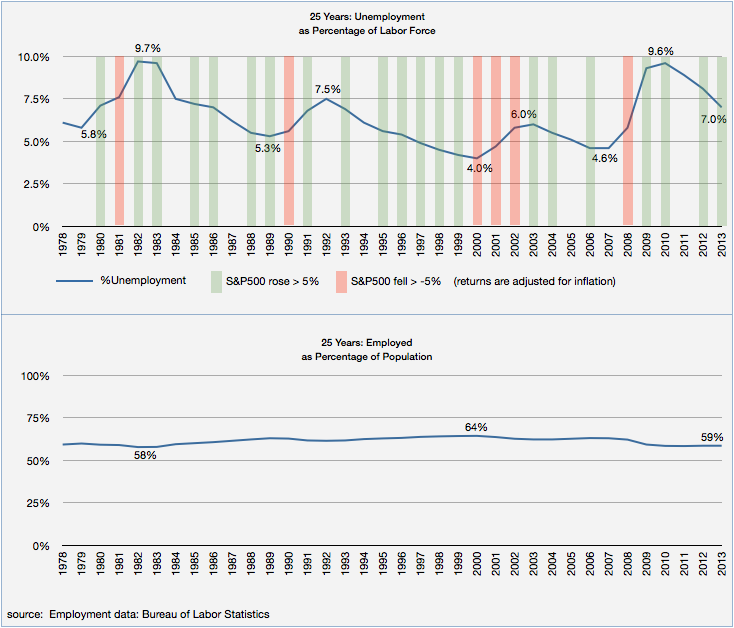
Sometimes we follow an economic statistic so closely that we lose sight of the bigger picture. Below are charts of two statistics from the US Bureau of Labor Statistics over the last 25 years: unemployment as a percentage of the labor force, and employment as a percentage of the population. The top chart is scaled from 0% to 10% and the bottom chart is scaled from 0% to 100%.
In the top chart, it’s easy to see the four recessions during these 25 years. Current unemployment, at 7.0%, is historically high, but the downward trend seems clear at this point. As in past recessions, the loss of jobs is swift and the recovery is slow. The highest unemployment was in 1982: 9.7%. That was a terrible period for the US economy: high unemployment and high inflation.
That chart also implies that the future will bring another recession where we’ll see higher unemployment followed by a recovery. The cycle goes on, but we don’t know the timing.
The green and red bars show the real (inflation-adjusted) investment returns of the 500 largest companies in the US: the S&P 500 index. A green bar is >5% gain; red is -5% or worse. Recessions are correlated with poor returns. The 2000 recession delivered three bad years in a row. The 2008-2009 recession caused only one bad year (2008), but it was really bad: -37%. The next year, in 2009, that return was 24%, which wasn’t nearly enough to offset the ’08 losses.
The bottom chart is not widely quoted in the press — possibly because it hasn’t changed much in 25 years. This is the percentage of the population that is working. It has varied slightly in the range of 58% to 64% over the whole 25 years, peaking in 2000 and now at 59%. Lots of demographic and economic factors influence that number.
Is that chart a surprise? Did you expect greater variation?
One caution about the S&P500 market returns: it might be tempting to divine some pattern of future gains since there were only six bad years during the past 25. But the dynamic nature of the world economy and speculative nature of capital markets means that the future can be very different from the past. No one knows what future returns will be.
